Tocmai am ajuns în Kyoto (京都), Japonia, din Montréal, Canada. Totul pare foarte diferit. Încă mai am în minte timpul petrecut în Hong Kong (mai mult de un an), dar asta a fost acum 25 de ani … doar pentru a compara, am folosit pagina Wikipedia din Kyoto vs. Montréal. Destul de natural, am folosit paginile în franceză, dar asta nu a fost o prostie, deoarece paginile din engleză sunt mai compexe pentru a citi (cu temperaturi în ° C și ° F, umiditate în mm și inci, etc.).
urlM="https://fr.wikipedia.org/wiki/Montr%C3%A9al"
urlK="https://fr.wikipedia.org/wiki/Kyoto"
download.file(urlM,destfile = "tempMtrl.html")
download.file(urlK,destfile = "tempKt.html")
library(XML)
Apoi extragem tabelele cu informații importante
tables=readHTMLTable("tempKt.html")
TK=tables((6))
TK() <- lapply(TK, function(col) {
if (is.character(col)) {
col <- gsub(",", ".", col)
col <- gsub("\s", "", col)
}
suppressWarnings(as.numeric(col))
})
tables=readHTMLTable("tempMtrl.html")
TM=tables((7))(,-1)
TM() <- lapply(TM, function(col) {
if (is.character(col)) {
col <- gsub("u2212", "-", col)
col <- gsub(",", ".", col)
col <- gsub("\s", "", col)
}
suppressWarnings(as.numeric(col))
})
Și le complotăm
cols <- paste0("V", 2:13)
mois <- c("JAN","FEB","MAR","APR","MAY","JUN","JUL","AUG","SEP","OCT","NOV","DEC")
yminK <- suppressWarnings(as.numeric(TK(2, cols)))
ymaxK <- suppressWarnings(as.numeric(TK(3, cols)))
yminM <- suppressWarnings(as.numeric(TM(2, cols)))
ymaxM <- suppressWarnings(as.numeric(TM(3, cols)))
y0K <- pmin(yminK, ymaxK, na.rm = TRUE)
y1K <- pmax(yminK, ymaxK, na.rm = TRUE)
y0M <- pmin(yminM, ymaxM, na.rm = TRUE)
y1M <- pmax(yminM, ymaxM, na.rm = TRUE)
x <- seq_along(cols)
plot(NA,
xlim = c(0.5, length(cols) + 0.5),
ylim = range(y0M, y1M, y0K, y1K, na.rm = TRUE),
xaxt = "n", xlab = "", ylab = "",
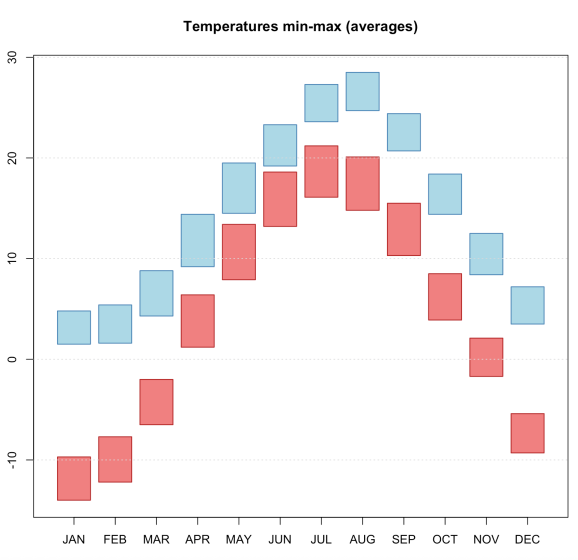
main = "Temperatures min-max (°C, averages)")
axis(1, at = x, labels = mois)
w <- 0.8
for (i in x) {
if (!is.na(y0(i)) && !is.na(y1(i))) {
rect(i - w/2, y0K(i), i + w/2, y1K(i),
col = "lightblue", border = "steelblue", lwd = 1.2)
}
}
for (i in x) {
if (!is.na(y0(i)) && !is.na(y1(i))) {
rect(i - w/2, y0M(i), i + w/2, y1M(i),
col = "lightcoral", border = "firebrick", lwd = 1.2)
}
}
grid(nx = NA, ny = NULL, col = "gray85")
cu Kyoto în albastru, Montréal în roșu,
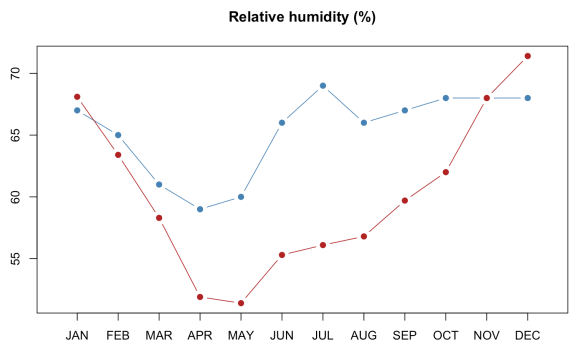
Desigur, putem face același lucru pentru umiditate
![]()
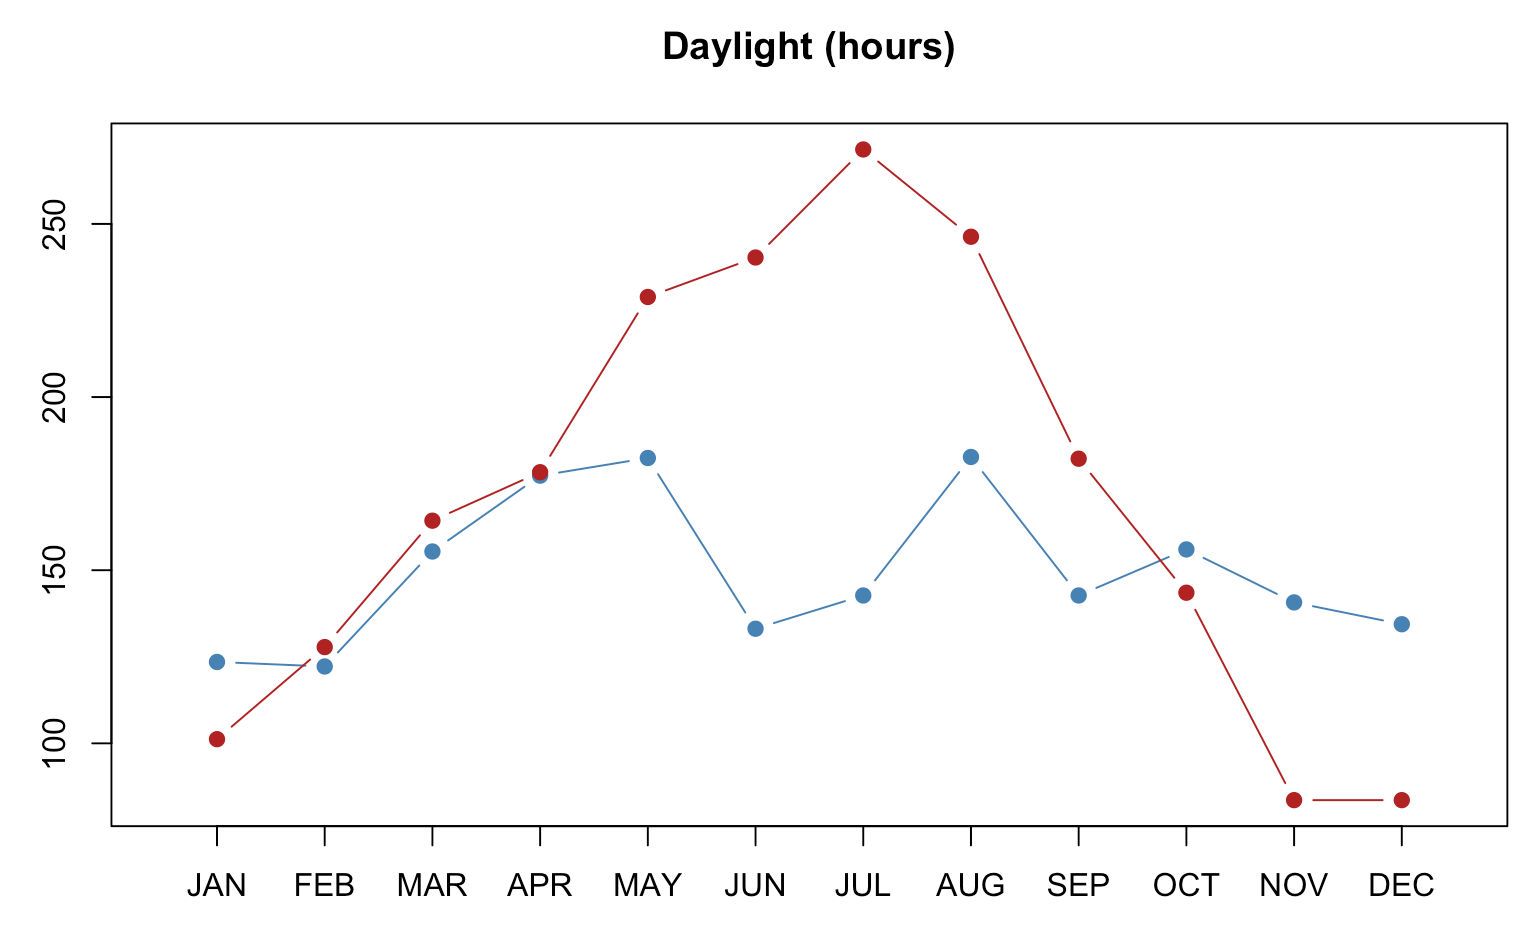
sau lumina zilei
![]()