Acum 2 zile, am prezentat o implementare citonizată a NGBOOST. NGBOOST este un algoritm de stimulare probabilistic care oferă Estimări de incertitudine împreună cu predicții. Funcționează prin potrivirea unui elev de bază (cum ar fi arbori de decizie sau modele liniare) la gradientul negativ al unei funcții de pierdere specificate și a fost Prima dată introdusă de Stanford Machine Learning Group în lucrare „NgBoost: Gradientul natural stimularea pentru predicția probabilistică ”de Duan și colab. (2019).
În această postare, vom explora modul de utilizare a NGBOOST, o bibliotecă puternică pentru prognoză probabilistică, în colaborare cu nnetsauce şi cybooster Biblioteci pentru a efectua analize de serii de timp cu cuantificarea incertitudinii native. Diferența cu postarea anterioară este că vom folosi capacitățile de cuantificare a incertitudinii native ale NGBOOST.
!pip install git+https://github.com/Techtonique/nnetsauce.git

!pip install git+https://github.com/Techtonique/cybooster.git
https://docs.techtonique.net/cybooster/index.html
https://docs.techtonique.net/nnetsauce/index.html
import nnetsauce as ns
import pandas as pd
import numpy as np
from cybooster import NGBRegressor, NGBClassifier, SkNGBRegressor
from sklearn.datasets import load_diabetes, fetch_openml
from sklearn.model_selection import train_test_split
from sklearn.datasets import load_breast_cancer, load_iris, load_wine, load_digits
from sklearn.metrics import accuracy_score, mean_squared_error, root_mean_squared_error
from sklearn.linear_model import LinearRegression, Ridge, BayesianRidge
from sklearn.tree import ExtraTreeRegressor
from time import time
url = "https://raw.githubusercontent.com/Techtonique/"
url += "datasets/main/time_series/multivariate/"
url += "ice_cream_vs_heater.csv"
df_temp = pd.read_csv(url)
df_temp.index = pd.DatetimeIndex(df_temp.date)
# must have# first other difference
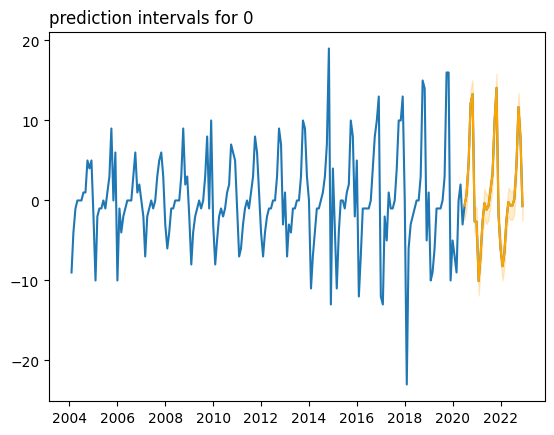
df_icecream = df_temp.drop(columns=('date')).diff().dropna()
regr = ns.MTS(obj=SkNGBRegressor(),
lags=20,
type_pi="gaussian",
show_progress=True)
regr.fit(df_icecream, return_std=True)
preds = regr.predict(h=30) # Store prediction results
regr.plot()
100%|██████████| 2/2 (00:08<00:00, 4.38s/it)
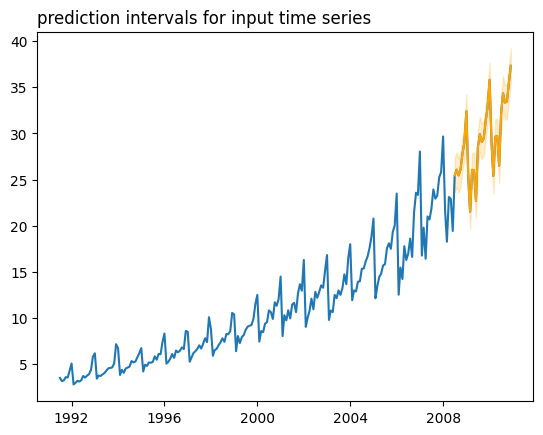
url = "https://raw.githubusercontent.com/Techtonique/"
url += "datasets/main/time_series/univariate/"
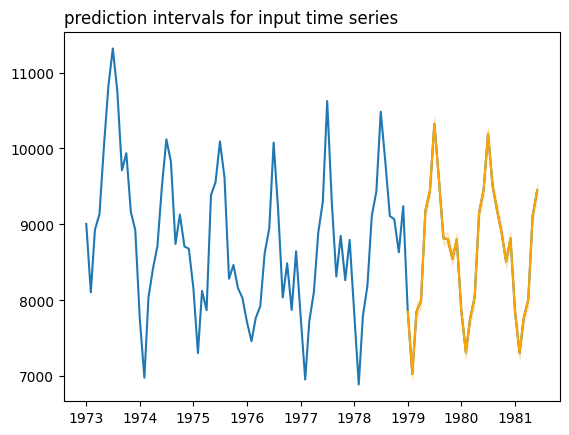
url += "USAccDeaths.csv"
df_temp = pd.read_csv(url)
df_temp.index = pd.DatetimeIndex(df_temp.date)
# must have# first other difference
df = df_temp.drop(columns=('date'))
regr = ns.MTS(obj=SkNGBRegressor(),
lags=20,
type_pi="gaussian",
show_progress=True)
regr.fit(df, return_std=True)
preds = regr.predict(h=30) # Store prediction results
regr.plot()
100%|██████████| 1/1 (00:01<00:00, 1.25s/it)

url = "https://raw.githubusercontent.com/Techtonique/"
url += "datasets/main/time_series/univariate/"
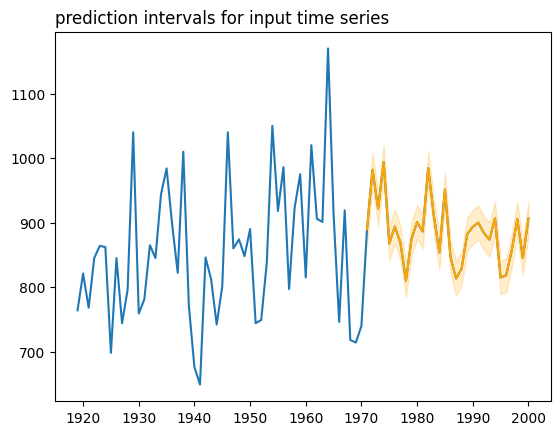
url += "nile.csv"
df_temp = pd.read_csv(url)
df_temp.index = pd.DatetimeIndex(df_temp.date)
# must have# first other difference
df = df_temp.drop(columns=('date'))
regr = ns.MTS(obj=SkNGBRegressor(),
lags=20,
type_pi="gaussian",
show_progress=True)
regr.fit(df, return_std=True)
preds = regr.predict(h=30) # Store prediction results
regr.plot()
100%|██████████| 1/1 (00:02<00:00, 2.36s/it)
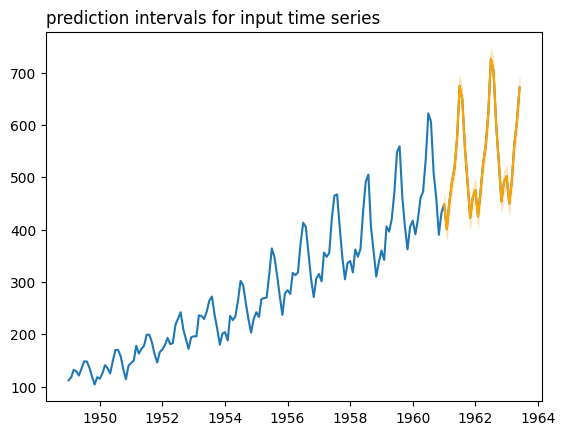
from sklearn.linear_model import LinearRegression

url = "https://raw.githubusercontent.com/Techtonique/"
url += "datasets/main/time_series/univariate/"
url += "AirPassengers.csv"

df_temp = pd.read_csv(url)
df_temp.index = pd.DatetimeIndex(df_temp.date)
# must have# first other difference
df = df_temp.drop(columns=('date'))


regr = ns.MTS(obj=SkNGBRegressor(LinearRegression()),
              lags=20,
              type_pi="gaussian",
              show_progress=True)
regr.fit(df, return_std=True)
preds = regr.predict(h=30) # Store prediction results
regr.plot()

100%|██████████| 1/1 (00:01<00:00,  1.11s/it)
from sklearn.linear_model import Ridge

url = "https://raw.githubusercontent.com/Techtonique/"
url += "datasets/main/time_series/univariate/"
url += "a10.csv"

df_temp = pd.read_csv(url)
df_temp.index = pd.DatetimeIndex(df_temp.date)
# must have# first other difference
df = df_temp.drop(columns=('date'))


regr = ns.MTS(obj=SkNGBRegressor(Ridge()),
              lags=15,
              type_pi="gaussian",
              show_progress=True)
regr.fit(df, return_std=True)
preds = regr.predict(h=30) # Store prediction results
regr.plot()

100%|██████████| 1/1 (00:00<00:00,  1.01it/s)
%load_ext rpy2.ipython
%%R
install.packages("pak")
pak::pak("reticulate")
%%R
pak::pak(c("readr", "xts", "ggplot2"))
%%R
# Load necessary libraries
library(reticulate)
library(readr)
library(xts)
library(ggplot2)
# Import Python packages
ns <- import("nnetsauce")
cyb <- import("cybooster")
sklearn <- import("sklearn")
# Load the dataset
url <- "https://raw.githubusercontent.com/Techtonique/datasets/main/time_series/multivariate/ice_cream_vs_heater.csv"
df_temp <- read.csv(url)
%%R
head(df_temp)
date heater icecream
1 2004-01-01 27 13
2 2004-02-01 18 15
3 2004-03-01 14 16
4 2004-04-01 13 19
5 2004-05-01 13 21
6 2004-06-01 13 24
%%R
np <- import("numpy")
# Assuming SkNGBRegressor is available in the sklearn R package or a similar implementation
# If not, you might need to use a different model or wrap the Python version
regr <- ns$MTS(obj = cyb$SkNGBRegressor(),
lags = 20L,
type_pi = "gaussian",
show_progress = TRUE)
%%R
df <- df_temp(, -1)
rownames(df) <- df_temp$date
%%R
df
heater icecream
2004-01-01 27 13
2004-02-01 18 15
2004-03-01 14 16
2004-04-01 13 19
2004-05-01 13 21
2004-06-01 13 24
2004-07-01 13 27
2004-08-01 14 20
2004-09-01 15 18
2004-10-01 20 15
2004-11-01 24 15
2004-12-01 29 14
2005-01-01 27 15
2005-02-01 17 15
2005-03-01 15 17
2005-04-01 14 19
2005-05-01 13 22
2005-06-01 13 28
2005-07-01 12 29
2005-08-01 13 21
2005-09-01 16 16
2005-10-01 25 14
2005-11-01 25 14
2005-12-01 31 14
2006-01-01 21 14
2006-02-01 20 15
2006-03-01 16 16
2006-04-01 14 19
2006-05-01 13 23
2006-06-01 13 27
2006-07-01 13 32
2006-08-01 13 24
2006-09-01 16 19
2006-10-01 22 16
2006-11-01 23 16
2006-12-01 25 17
2007-01-01 25 16
2007-02-01 23 17
2007-03-01 16 18
2007-04-01 14 20
2007-05-01 13 25
2007-06-01 13 30
2007-07-01 12 29
2007-08-01 12 23
2007-09-01 15 19
2007-10-01 20 15
2007-11-01 26 15
2007-12-01 29 16
2008-01-01 26 15
2008-02-01 20 17
2008-03-01 16 17
2008-04-01 15 20
2008-05-01 14 25
2008-06-01 14 28
2008-07-01 14 28
2008-08-01 14 23
2008-09-01 17 18
2008-10-01 26 15
2008-11-01 28 15
2008-12-01 31 14
2009-01-01 29 15
2009-02-01 21 17
2009-03-01 17 18
2009-04-01 15 22
2009-05-01 14 27
2009-06-01 14 32
2009-07-01 13 34
2009-08-01 13 30
2009-09-01 16 24
2009-10-01 24 19
2009-11-01 23 20
2009-12-01 33 18
2010-01-01 30 18
2010-02-01 22 19
2010-03-01 17 21
2010-04-01 15 23
2010-05-01 14 28
2010-06-01 12 30
2010-07-01 11 34
2010-08-01 12 28
2010-09-01 14 22
2010-10-01 21 18
2010-11-01 27 17
2010-12-01 32 16
2011-01-01 31 24
2011-02-01 24 24
2011-03-01 18 25
2011-04-01 15 45
2011-05-01 14 34
2011-06-01 14 41
2011-07-01 13 46
2011-08-01 14 35
2011-09-01 17 30
2011-10-01 25 30
2011-11-01 31 27
2011-12-01 32 29
2012-01-01 28 30
2012-02-01 21 30
2012-03-01 17 35
2012-04-01 15 39
2012-05-01 14 46
2012-06-01 13 53
2012-07-01 13 55
2012-08-01 13 41
2012-09-01 16 31
2012-10-01 25 24
2012-11-01 32 23
2012-12-01 29 23
2013-01-01 30 24
2013-02-01 23 25
2013-03-01 20 27
2013-04-01 16 31
2013-05-01 15 37
2013-06-01 14 44
2013-07-01 14 48
2013-08-01 14 37
2013-09-01 17 28
2013-10-01 27 22
2013-11-01 36 21
2013-12-01 39 21
2014-01-01 39 24
2014-02-01 28 24
2014-03-01 21 28
2014-04-01 17 32
2014-05-01 16 39
2014-06-01 15 45
2014-07-01 15 51
2014-08-01 16 40
2014-09-01 19 28
2014-10-01 26 23
2014-11-01 45 21
2014-12-01 32 22
2015-01-01 36 24
2015-02-01 32 26
2015-03-01 21 33
2015-04-01 17 40
2015-05-01 17 46
2015-06-01 17 49
2015-07-01 16 57
2015-08-01 17 45
2015-09-01 19 35
2015-10-01 29 27
2015-11-01 37 26
2015-12-01 35 25
2016-01-01 40 30
2016-02-01 28 32
2016-03-01 21 38
2016-04-01 20 45
2016-05-01 19 51
2016-06-01 18 61
2016-07-01 17 71
2016-08-01 17 52
2016-09-01 21 42
2016-10-01 29 39
2016-11-01 39 46
2016-12-01 52 66
2017-01-01 40 35
2017-02-01 27 39
2017-03-01 25 44
2017-04-01 20 55
2017-05-01 21 60
2017-06-01 20 74
2017-07-01 19 89
2017-08-01 19 64
2017-09-01 23 48
2017-10-01 33 40
2017-11-01 43 36
2017-12-01 56 35
2018-01-01 56 40
2018-02-01 33 42
2018-03-01 27 51
2018-04-01 24 56
2018-05-01 22 71
2018-06-01 21 79
2018-07-01 21 91
2018-08-01 21 66
2018-09-01 24 49
2018-10-01 39 39
2018-11-01 53 34
2018-12-01 48 36
2019-01-01 49 39
2019-02-01 39 42
2019-03-01 30 53
2019-04-01 24 57
2019-05-01 23 65
2019-06-01 22 82
2019-07-01 21 100
2019-08-01 21 68
2019-09-01 24 51
2019-10-01 40 40
2019-11-01 56 36
2019-12-01 46 36
2020-01-01 41 43
2020-02-01 34 45
2020-03-01 25 44
2020-04-01 25 53
2020-05-01 27 70
2020-06-01 24 74
%%R
# Fit the model
regr$fit(df)
100%|██████████| 2/2 (00:05<00:00, 2.66s/it)
MTS(lags=20, obj=SkNGBRegressor(), type_pi='gaussian')
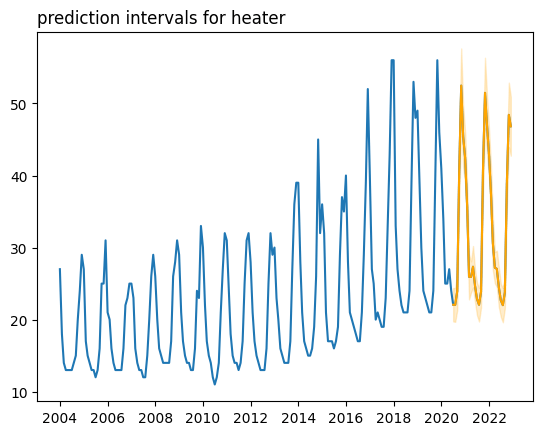
%%R
library(ggplot2)
# Make predictions
preds <- regr$predict(h = 30L, return_std=TRUE)
# Plot the results
regr$plot("heater")
regr$plot("icecream")
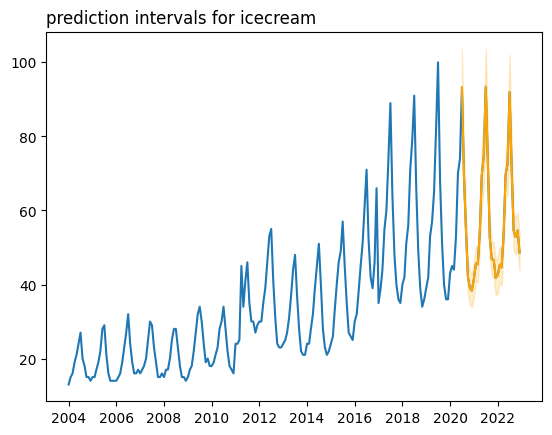
%%R

preds

DescribeResult(mean=            heater  icecream
date
2020-07-01   22.07     93.22
2020-08-01   22.04     69.47
2020-09-01   23.94     54.68
2020-10-01   40.38     42.04
2020-11-01   52.47     39.01
2020-12-01   45.44     38.33
2021-01-01   42.34     41.62
2021-02-01   35.54     45.68
2021-03-01   25.94     45.46
2021-04-01   25.93     54.19
2021-05-01   27.34     69.47
2021-06-01   24.67     74.85
2021-07-01   22.86     93.39
2021-08-01   22.07     73.81
2021-09-01   23.86     52.58
2021-10-01   40.81     46.88
2021-11-01   51.47     46.63
2021-12-01   47.05     41.83
2022-01-01   42.96     42.51
2022-02-01   37.37     45.35
2022-03-01   30.64     44.62
2022-04-01   27.21     53.50
2022-05-01   27.05     69.65
2022-06-01   24.48     72.62
2022-07-01   22.68     91.98
2022-08-01   22.01     71.78
2022-09-01   23.78     54.59
2022-10-01   38.75     52.85
2022-11-01   48.41     54.60
2022-12-01   46.83     48.62, lower=            heater  icecream
date
2020-07-01   20.34     90.50
2020-08-01   20.31     66.75
2020-09-01   22.21     51.96
2020-10-01   38.65     39.32
2020-11-01   50.75     36.28
2020-12-01   43.71     35.61
2021-01-01   40.61     38.90
2021-02-01   33.81     42.96
2021-03-01   24.21     42.73
2021-04-01   24.20     51.47
2021-05-01   25.61     66.75
2021-06-01   22.95     72.13
2021-07-01   21.14     90.67
2021-08-01   20.34     71.09
2021-09-01   22.13     49.86
2021-10-01   39.09     44.16
2021-11-01   49.74     43.91
2021-12-01   45.33     39.11
2022-01-01   41.24     39.78
2022-02-01   35.64     42.63
2022-03-01   28.91     41.90
2022-04-01   25.48     50.77
2022-05-01   25.32     66.92
2022-06-01   22.76     69.90
2022-07-01   20.95     89.26
2022-08-01   20.28     69.06
2022-09-01   22.05     51.87
2022-10-01   37.02     50.13
2022-11-01   46.69     51.88
2022-12-01   45.10     45.90, upper=            heater  icecream
date
2020-07-01   23.80     95.94
2020-08-01   23.77     72.19
2020-09-01   25.67     57.40
2020-10-01   42.11     44.77
2020-11-01   54.20     41.73
2020-12-01   47.16     41.05
2021-01-01   44.06     44.35
2021-02-01   37.27     48.40
2021-03-01   27.67     48.18
2021-04-01   27.65     56.91
2021-05-01   29.07     72.19
2021-06-01   26.40     77.58
2021-07-01   24.59     96.12
2021-08-01   23.79     76.54
2021-09-01   25.58     55.31
2021-10-01   42.54     49.60
2021-11-01   53.20     49.36
2021-12-01   48.78     44.55
2022-01-01   44.69     45.23
2022-02-01   39.09     48.08
2022-03-01   32.36     47.34
2022-04-01   28.93     56.22
2022-05-01   28.78     72.37
2022-06-01   26.21     75.34
2022-07-01   24.40     94.70
2022-08-01   23.73     74.51
2022-09-01   25.50     57.32
2022-10-01   40.47     55.57
2022-11-01   50.14     57.33
2022-12-01   48.56     51.34)