(Acest articol a fost publicat pentru prima dată pe pacha.dev/blogși a contribuit cu drag la R-Bloggers). (Puteți raporta problema despre conținutul de pe această pagină aici)
Doriți să vă împărtășiți conținutul pe R-Bloggers? Faceți clic aici dacă aveți un blog sau aici dacă nu.
Din cauza întârzierilor cu plata bursei mele, dacă această postare vă este utilă, vă cer cu drag o donație minimă pentru a -mi cumpăra o cafea care va fi folosită pentru a continua eforturile mele open source. Dacă aveți nevoie de un pachet R sau un tablou de bord strălucitor pentru echipa dvs., puteți să -mi trimiteți un e -mail sau să întrebați pe Fiverr. Explicația completă este aici: un mesaj personal de la un contribuabil open source
Instalare
Puteți instala versiunea de dezvoltare a UKMAPS, așa cum:
remotes::install_github("pachadotdev/ukmaps")
Exemple
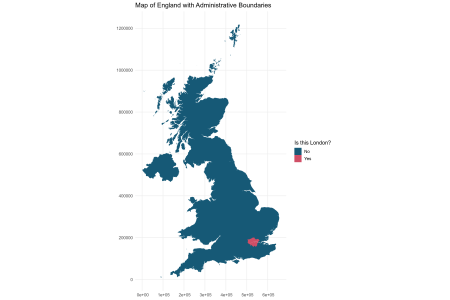
DA/NU MAP ALDRUMENTULUI ADMINISTRATIVE LONDRA:
library(ukmaps)
library(dplyr)
library(ggplot2)

d <- boundaries %>%
  mutate(
    region_name = if_else(is.na(region_name), "Notr Available", region_name),
    is_london = if_else(region_name == "London", "Yes", "No")
  )

pal <- c("#165976", "#d04e66")

ggplot(d) +
  geom_sf(aes(fill = is_london, geometry = geometry), color = "white", linewidth = 0) +
  scale_fill_manual(values = pal, name = "Is this London?") +
  labs(title = "Map of England with Administrative Boundaries") +
  theme_minimal(base_size = 13)
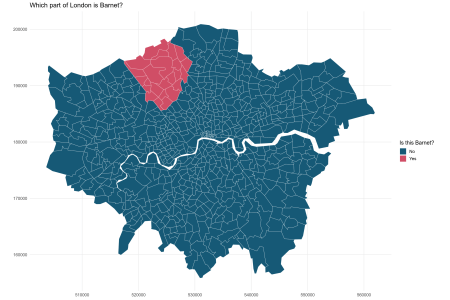
Ce parte din Londra este Barnet?
d <- boundaries %>%
  filter(region_name == "London") %>%
  mutate(is_barnet = if_else(lad_name == "Barnet", "Yes", "No"))

pal <- c("#165976", "#d04e66")

ggplot(d) +
  geom_sf(aes(fill = is_barnet, geometry = geometry), color = "white") +
  scale_fill_manual(values = pal, name = "Is this Barnet?") +
  labs(title = "Which part of London is Barnet?") +
  theme_minimal(base_size = 13)
![]()
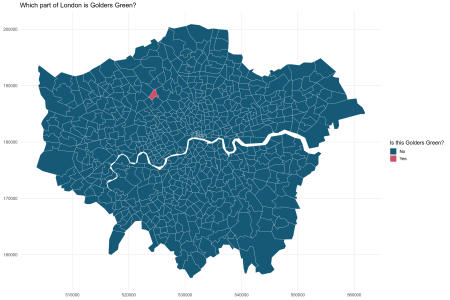
Ce parte din Londra este Golders Green?
d <- boundaries %>%
  filter(region_name == "London") %>%
  mutate(
    is_golders_green = if_else(ward_name == "Golders Green", "Yes", "No")
  )

pal <- c("#165976", "#d04e66")

ggplot(d) +
  geom_sf(aes(fill = is_golders_green, geometry = geometry), color = "white") +
  scale_fill_manual(values = pal, name = "Is this Golders Green?") +
  labs(title = "Which part of London is Golders Green?") +
  theme_minimal(base_size = 13)
![]()
Următoarele hărți utilizează funcții care agregă setul de date pentru a menține dimensiunea pachetului mic.
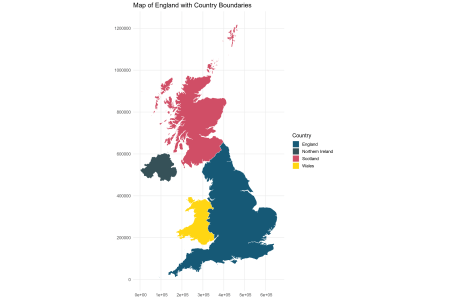
Harta la nivel de țară a Regatului Unit:
pal <- c("#165976", "#365158", "#d04e66", "#ffd613")

# country() aggregates the map to country level
ggplot(country()) +
  geom_sf(aes(fill = country_name, geometry = geometry), color = "white") +
  scale_fill_manual(values = pal, name = "Country") +
  labs(title = "Map of England with Country Boundaries") +
  theme_minimal(base_size = 13)
![]()
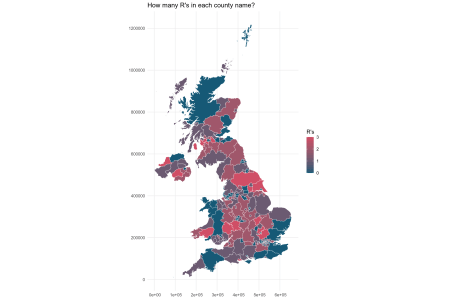
Câte R sunt în fiecare nume de județ?
# number of R's in county names
d <- counties() %>%
  mutate(n = stringr::str_count(county_name, "(rR)"))

# region() aggregates the map to country level
ggplot(d) +
  geom_sf(aes(fill = n, geometry = geometry), color = "white") +
  scale_fill_gradient(low = "#165976", high = "#d04e66", name = "R's",
                      breaks = seq(0, max(d$n), by = 1)) +
  labs(title = "How many R's in each county name?") +
  theme_minimal(base_size = 13)
![]()
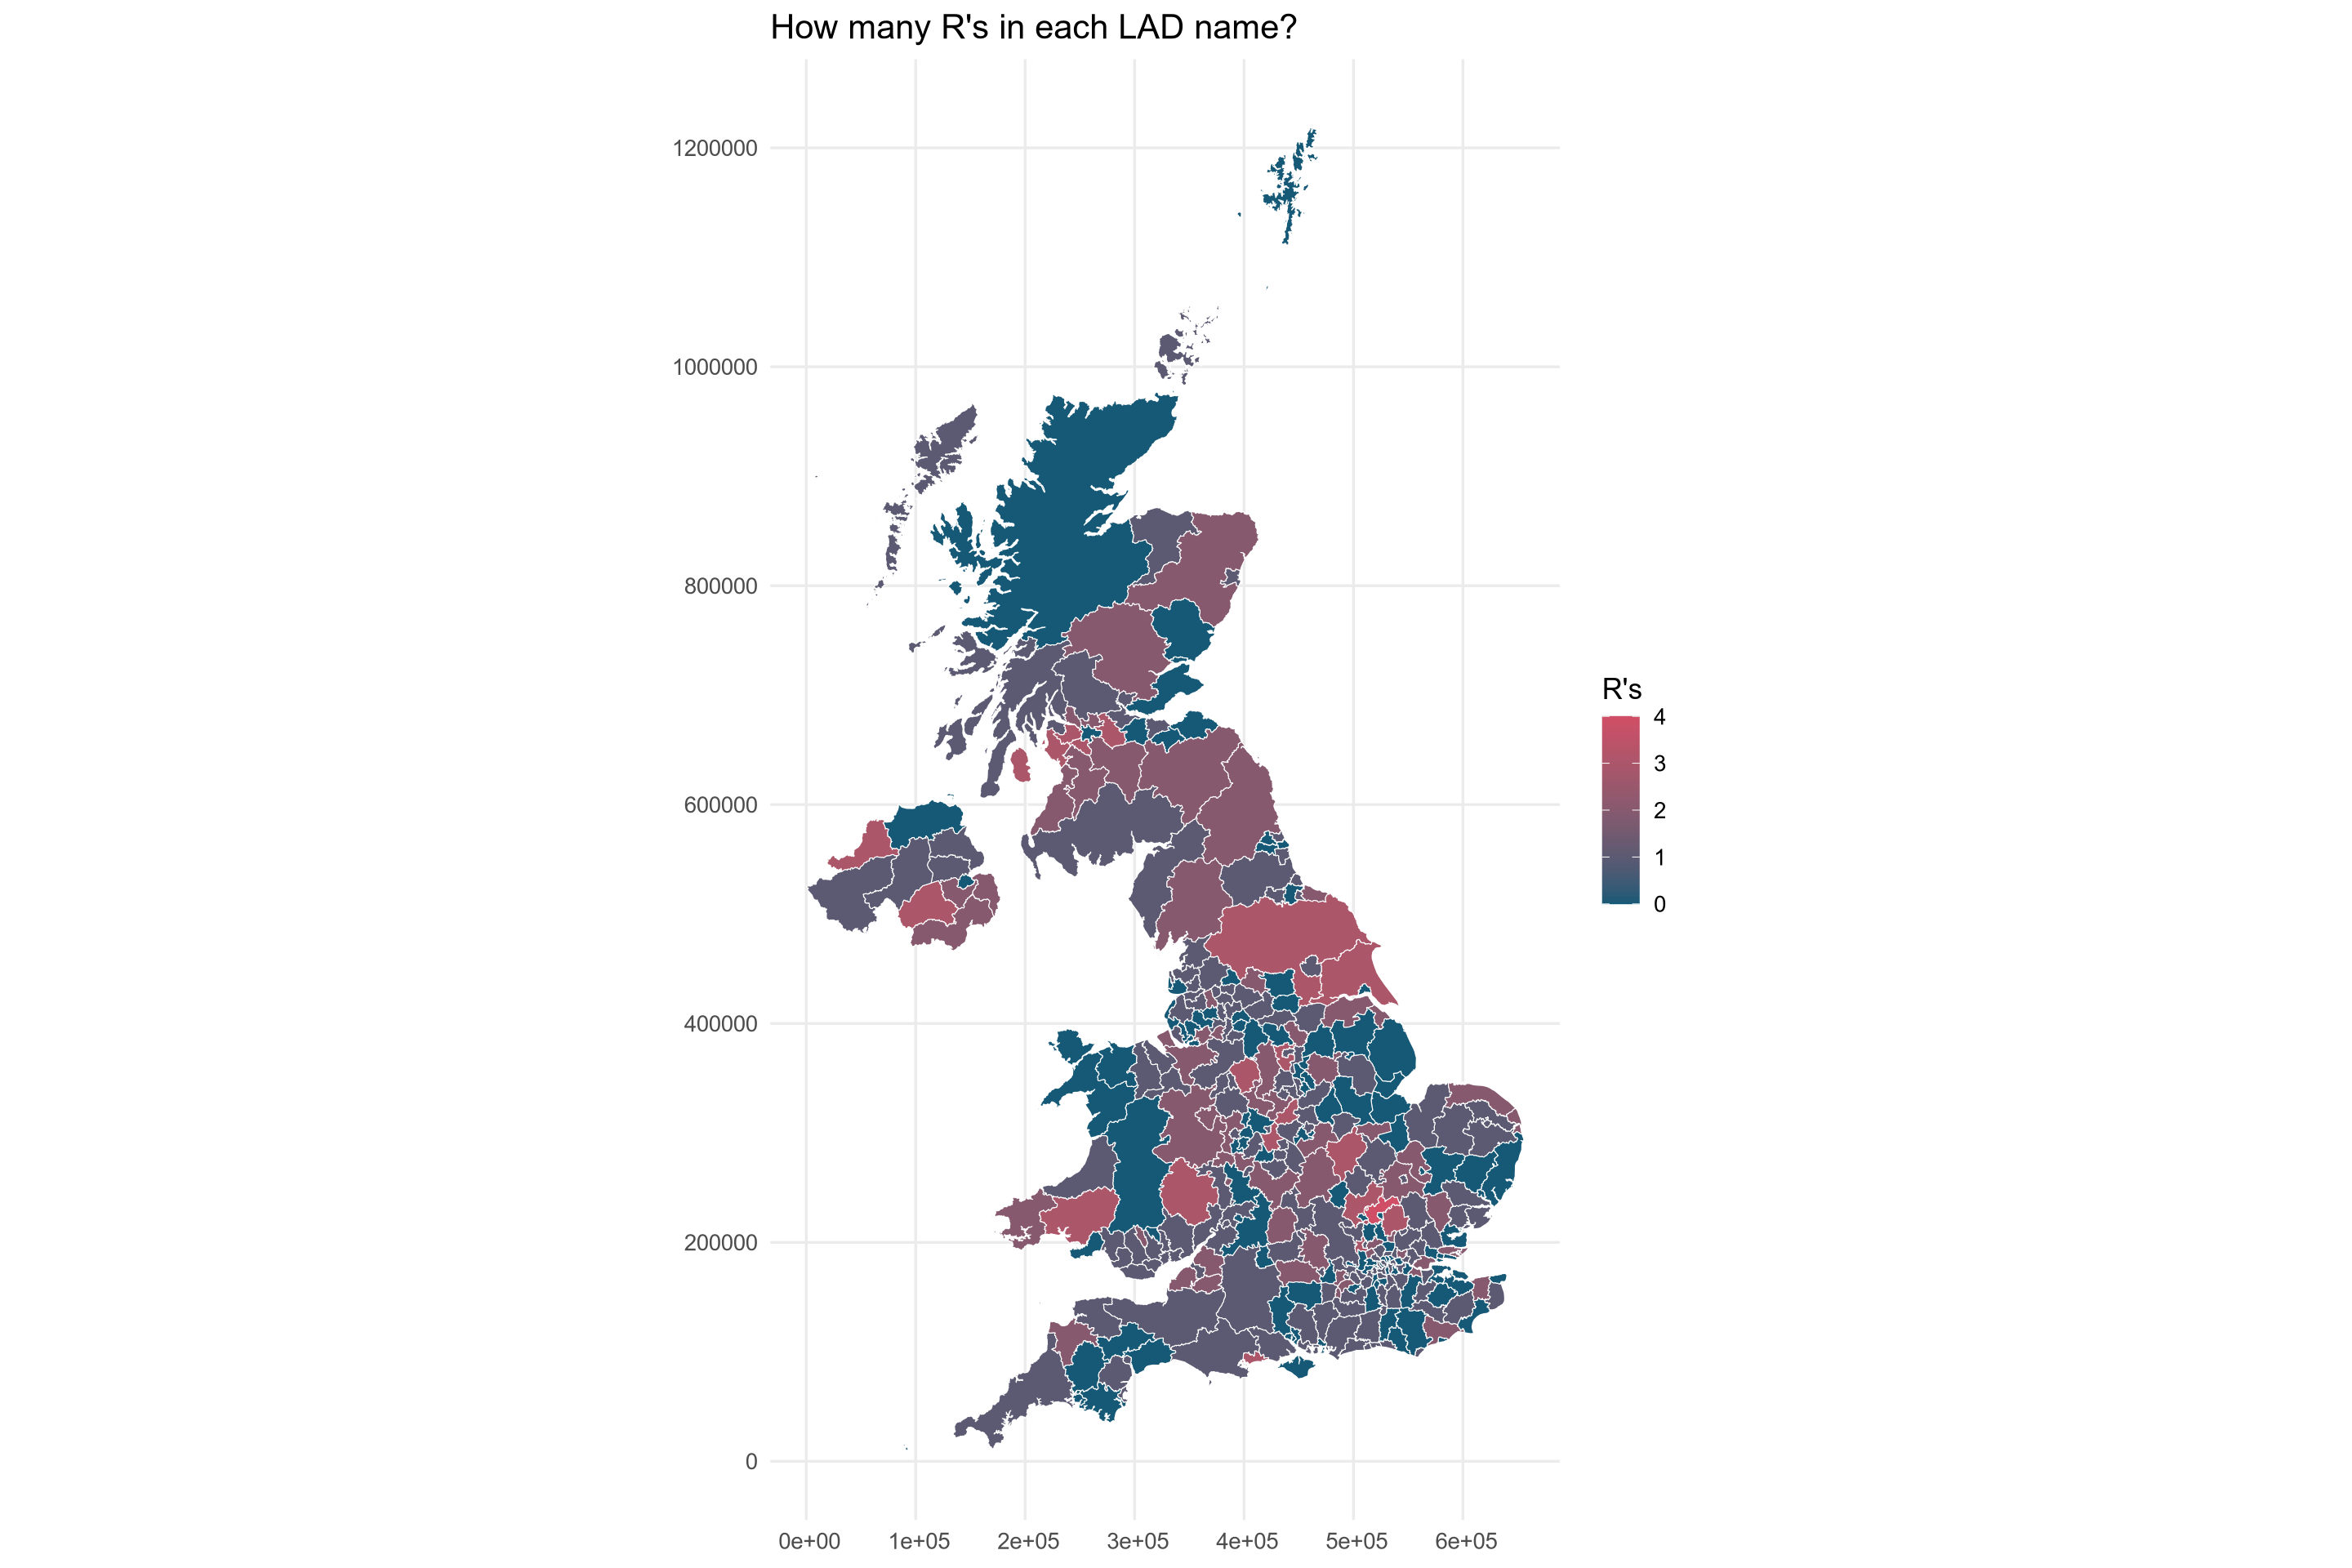
Câte R sunt în fiecare nume? Districtele autorității locale (LAD) (districtul administrației locale (LGD) din Irlanda de Nord)
d <- lads() %>%
  mutate(n = stringr::str_count(lad_name, "(rR)"))

ggplot(d) +
  geom_sf(aes(fill = n, geometry = geometry), color = "white") +
  scale_fill_gradient(low = "#165976", high = "#d04e66", name = "R's",
                      breaks = seq(0, max(d$n), by = 1)) +
  labs(title = "How many R's in each LAD name?") +
  theme_minimal(base_size = 13)
![]()